Analysis of macaque cerebral cortex network
Complex network analysis of macaque cerebral cortex network
In this project, the anatomical network of the macaque's cerebral cortex was analyzed from a complex network perspective. The results showed that this network follows a hierarchical and heterogeneous structure. In more detail, this network have assortative mixing pattern, rich-club organization, and small-world and small-woldness (six degrees of separation) phenomenon. Like many real-world complex networks, the appearance of small-world and small-woldness (six degrees of separation) phenomena in this network indicate that this network is efficient in exchanging information at both local and global scales. Considering the sparsity of this network, the trade-off between the regular and random organization of the network's connections can explain the small-woldness property. This project also assessed the relationship among different local centrality measures.
We used data from Logan Harriger et al. (2012) [Link to Paper]. "The data set used in this study consisted of 242 regions and 4090 directed projections represented in binary format. No distinction was made between strong versus weak connections, or between connections that were shown to be absent versus those for which no data were available and The matrix contained no self-connections."Harriger et al. (2012)
Below are some figures from the project.
Frequency histograms of centrality measures:

Comparison of centrality measures:

Rich-Club

Small-Worldness
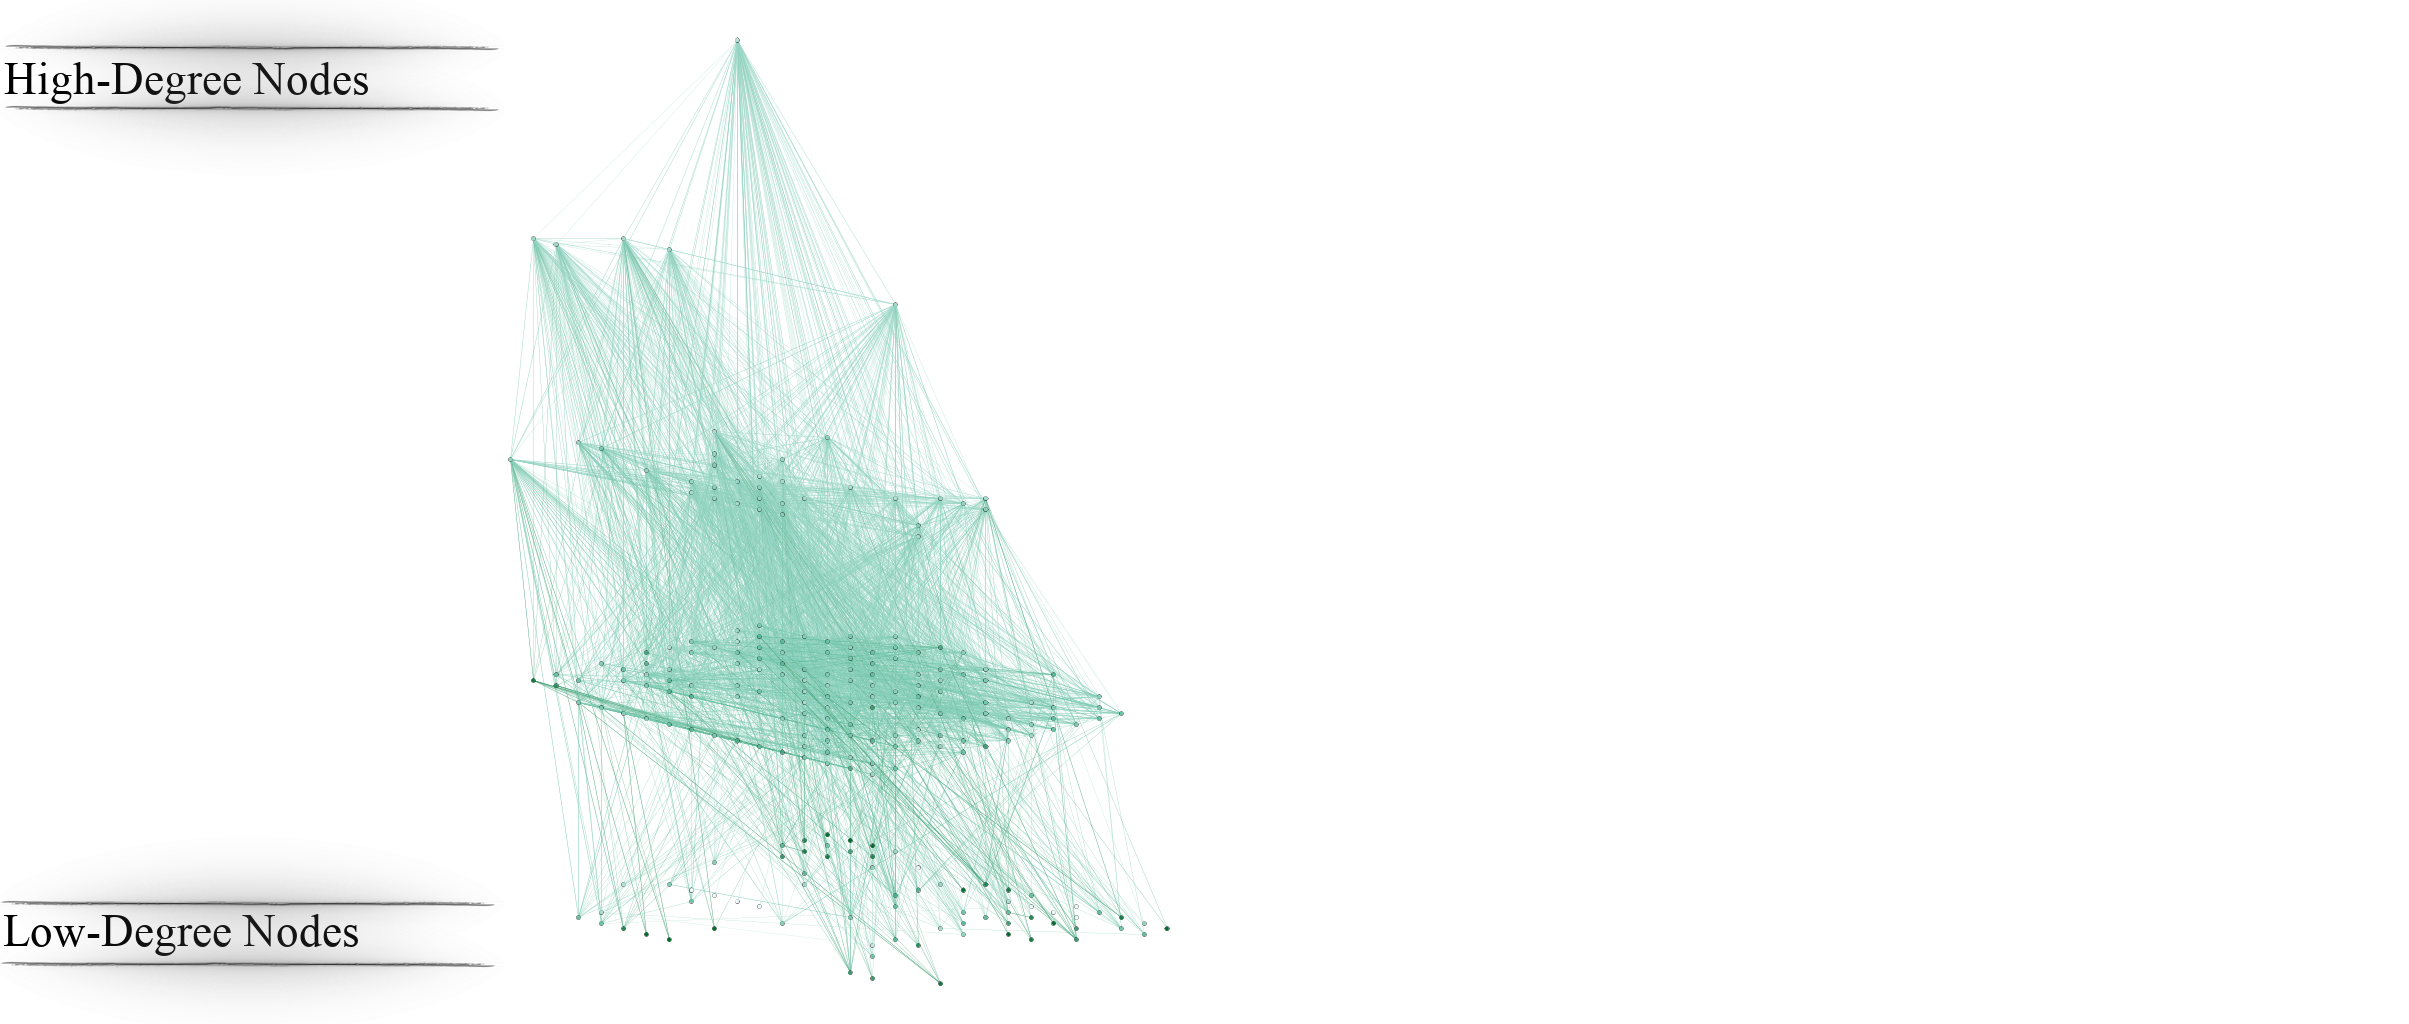
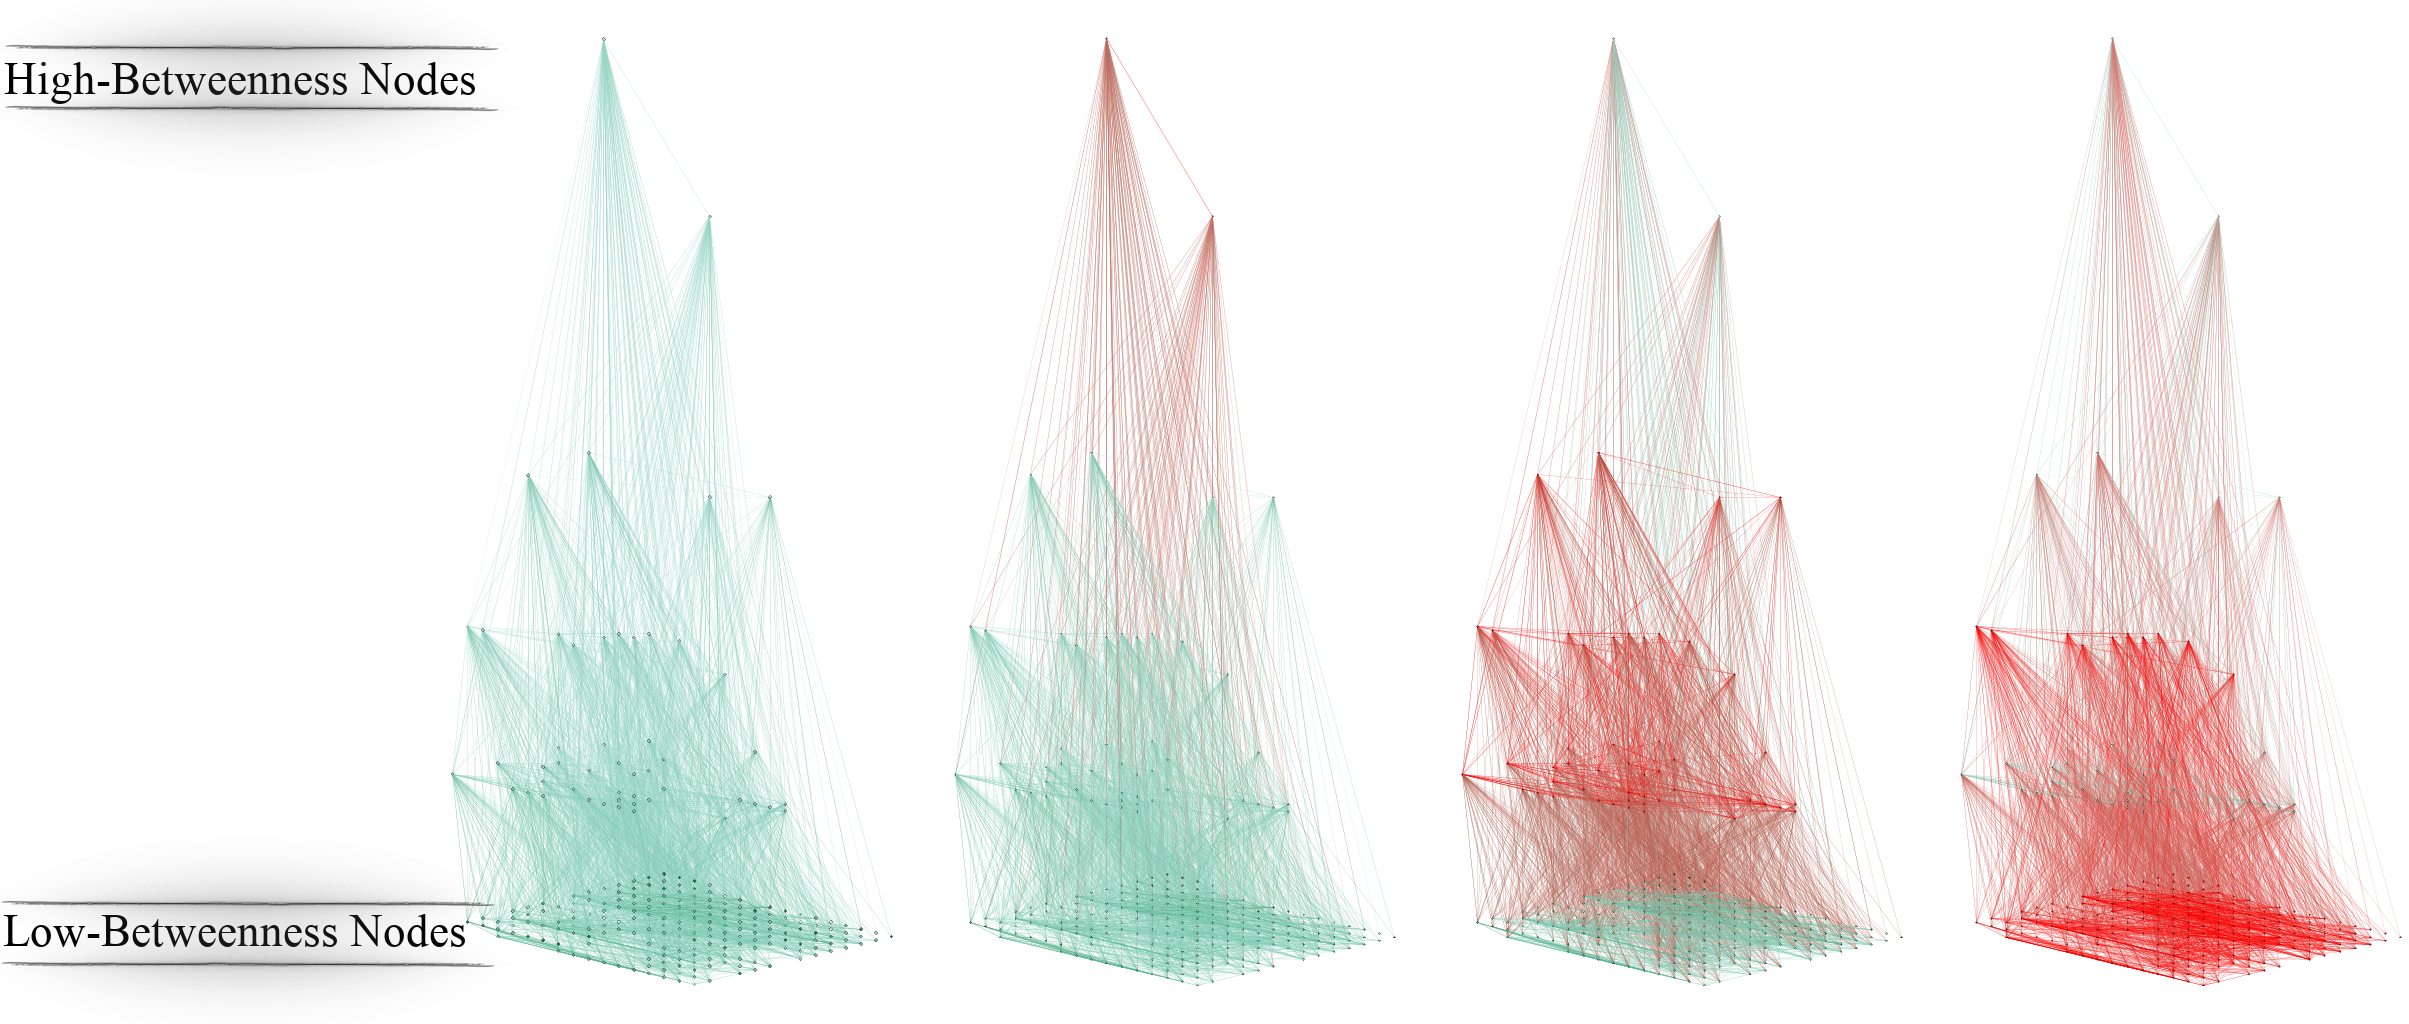
 Visualizations


In this project, the anatomical network of the macaque's cerebral cortex was analyzed from a complex network perspective. The results showed that this network follows a hierarchical and heterogeneous structure. In more detail, this network have assortative mixing pattern, rich-club organization, and small-world and small-woldness (six degrees of separation) phenomenon. Like many real-world complex networks, the appearance of small-world and small-woldness (six degrees of separation) phenomena in this network indicate that this network is efficient in exchanging information at both local and global scales. Considering the sparsity of this network, the trade-off between the regular and random organization of the network's connections can explain the small-woldness property. This project also assessed the relationship among different local centrality measures.
We used data from Logan Harriger et al. (2012) [Link to Paper]. "The data set used in this study consisted of 242 regions and 4090 directed projections represented in binary format. No distinction was made between strong versus weak connections, or between connections that were shown to be absent versus those for which no data were available and The matrix contained no self-connections."Harriger et al. (2012)
Below are some figures from the project.
Frequency histograms of centrality measures:

Comparison of centrality measures:

Rich-Club

Small-Worldness
 Visualizations
